Every investment.
One clear picture.
Bring your portfolios together. See what you own, how it’s performing, and where your money is really invested.
Takes 10 seconds · Read-only access · Free plan at launch
 InvestmentsSample portfolio
+€12,850 total return
01 / Bring it together
Different accounts.
Same perspective.
Your investments can live in different places. Understanding them shouldn’t mean starting from scratch in each one.
Connect your brokerages
Import accounts, holdings, and activity from supported brokers with read-only access.
Add the rest yourself
Create portfolios and add positions manually. View one account or your combined investments.
Make currencies comparable
Keep each holding’s native currency and see your totals in the display currency you choose.

9 asset classes. Room for your investment mix.
- Stocks
- ETFs
- Bonds
- Mutual funds
- Crypto
- REITs
- Commodities
- Options
- Futures
02 / Understand the change
What you put in.
What grew.
A bigger balance tells part of the story. Separate the money you contribute from the return your investments generate.
- Value history alongside your invested capital
- Returns adjusted for deposits and withdrawals
- Current prices, daily changes, and total P&L
Explore the two views
See your balance grow, with contributions visible alongside it.
From the portfolio to the position
The detail behind every number.
Compare your winners and losers, then inspect each position’s quantity, cost basis, price, and return. Follow buys, sells, dividends, and cash movements in one activity ledger.
Global equity ETF
- Quantity
- 240
- Average cost
- €140.00
- Current price
- €160.00
- Invested
- €33,600
- Portfolio weight
- 29.9%
- Currency
- EUR
Look inside the fund
Explore its underlying holdings, sectors, and regions when composition data is available.
03 / Look beneath the balance
Know what you’re
really exposed to.
See how your money is spread across assets, sectors, countries, and currencies. Understand your largest concentrations, even when your holdings sit in different accounts.
- Technology
- 32%
- Financials
- 24%
- Healthcare
- 18%
- Industrials
- 16%
- Other sectors
- 10%
See the sectors carrying the most weight across your holdings.
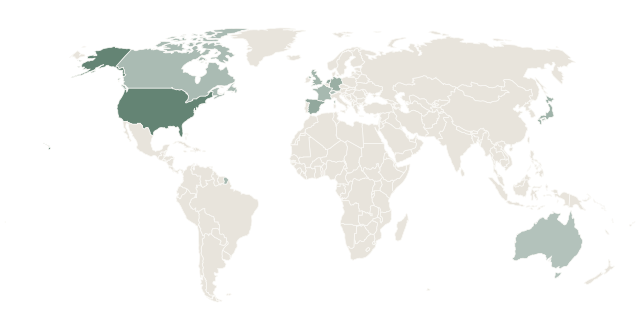
Go inside your funds. Open an ETF or mutual fund to explore its underlying holdings, sectors, and regional weights where composition data is available.
04 / Follow the money
What comes in.
What it costs.
Price changes are only part of your return. Give your dividend income and recorded investment costs their own clear view.
Income you can follow.
See received dividends, announced payouts, and forecasts by month, year, or holding.
Costs you can account for.
Track recorded fees and taxes, average cost per trade, and their share of your portfolio.
Recorded costs · last 12 months
of your current
portfolio value
A clear view of the costs in your activity ledger.
All previews use illustrative data. Forecast dividends are estimates.
Your wealth. In perspective.
Connect your accounts in minutes and replace the spreadsheet.
Takes 10 seconds · Read-only access · Free plan at launch